상담원 분석
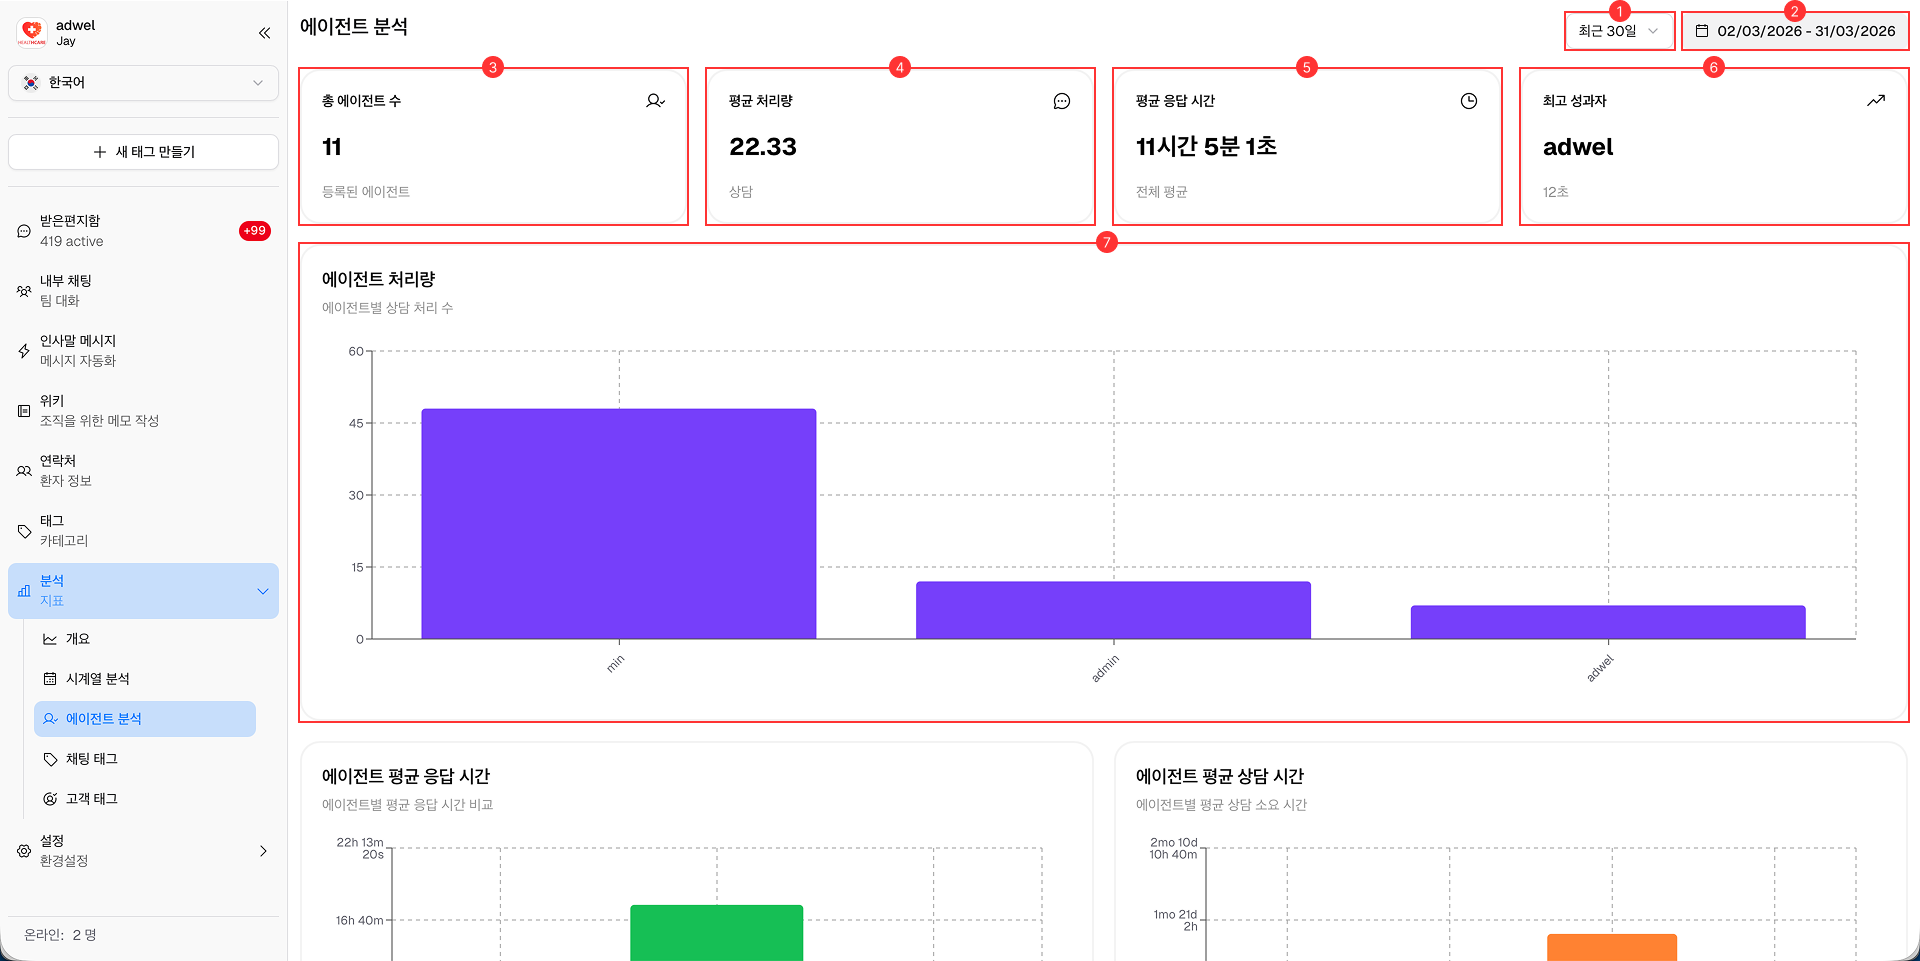
Agent Analysis 페이지는 선택한 기간 동안 Agent의 성과에 대한 인사이트를 제공합니다. 처리된 Chat 수, 평균 Response Time 등 다양한 지표를 분석할 수 있습니다.
-
Date Range Selector: Analytics 데이터를 볼 기간을 선택할 수 있습니다.
- 오늘 (Today)
- 지난주 (Last week)
- 지난 30일 (Last 30 days)
- 지난 90일 (Last 90 days)
- 지난 180일 (Last 180 days)
-
Date Display: Analytics 데이터에 대해 현재 선택된 날짜 범위를 보여줍니다. 사용자 지정 날짜를 선택할 때 사용할 수 있습니다.
-
Total Agents: 선택한 기간 동안 병원 내 전체 Agent 수를 표시합니다.
-
Average Processing Volume: 선택한 기간 동안 Agent가 처리한 평균 Chat 수를 나타냅니다.
-
Average Response Time: 선택한 기간 동안 Agent가 Chat에 응답하는 데 걸린 평균 시간을 보여줍니다.
-
Top Performer: 사전 정의된 지표를 기반으로 가장 높은 성과를 낸 Agent를 강조하여 보여줍니다.
-
Agent Processing Volume Chart: 선택한 기간 동안 Agent가 처리한 Chat 수를 그래프로 나타냅니다.
-
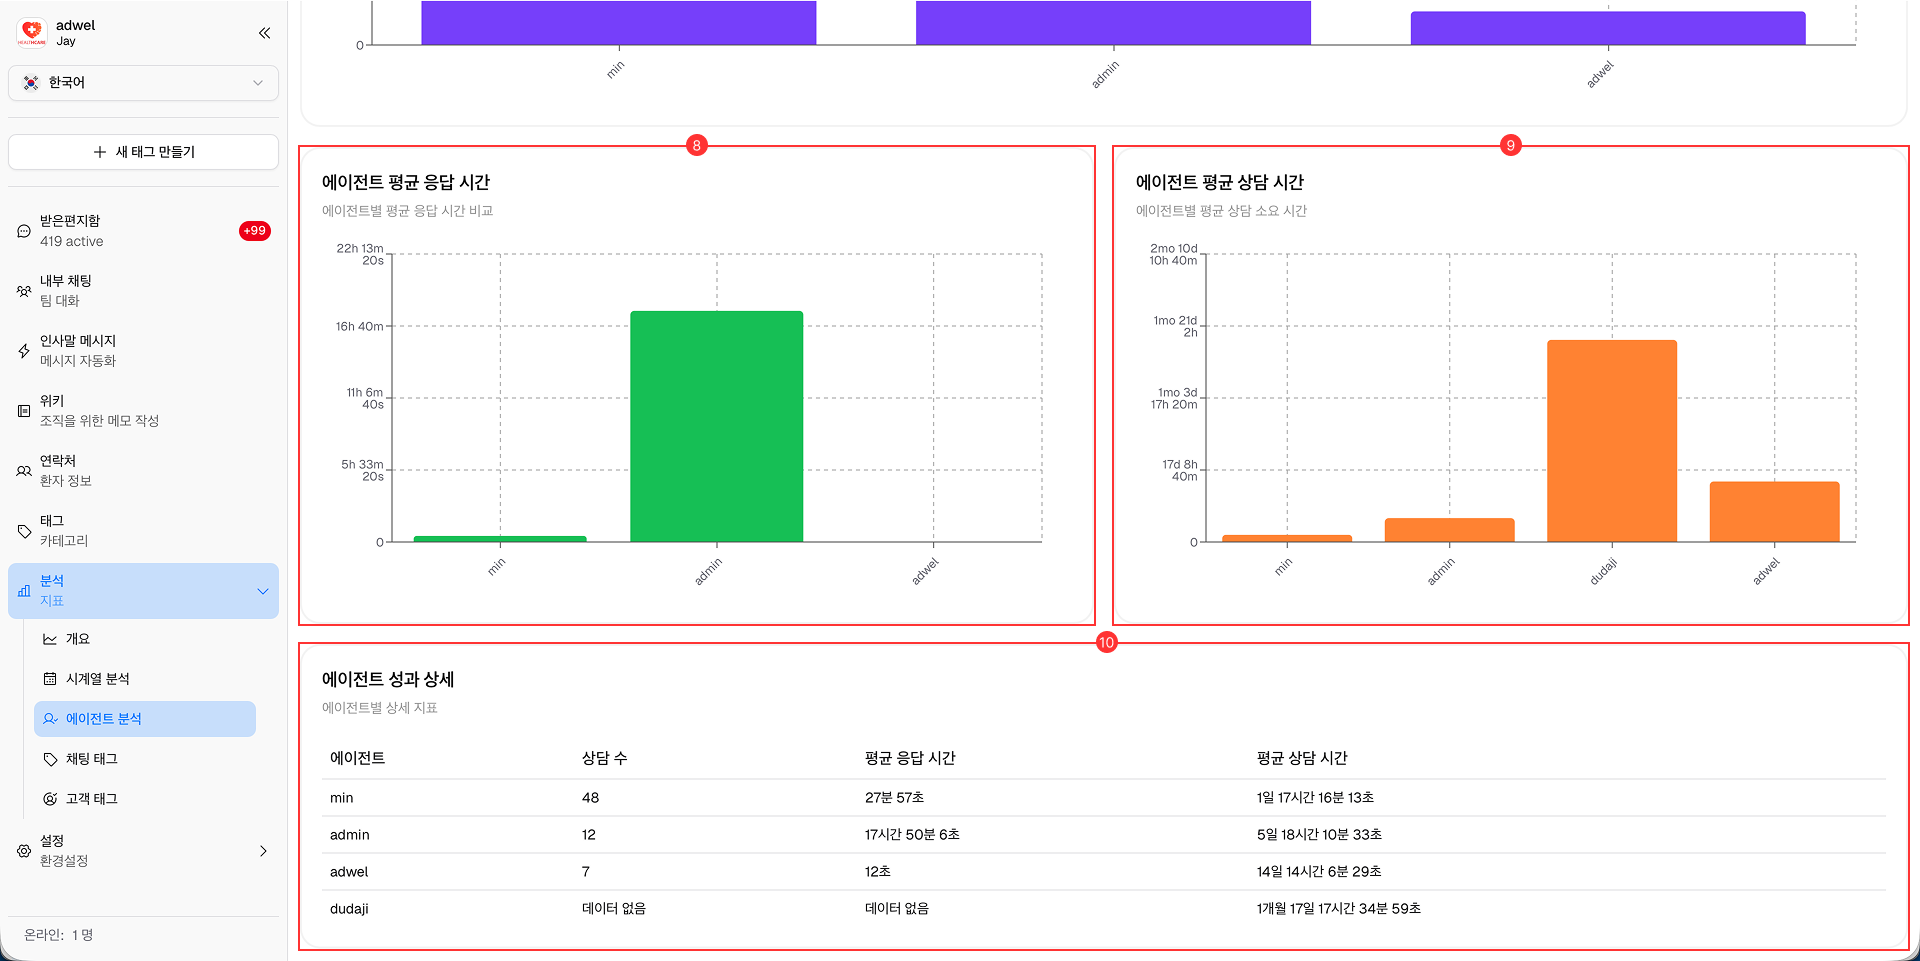
Agent Average Response Time Chart: 선택한 기간 동안 Agent의 평균 Response Time을 그래프로 나타냅니다.
-
Agent Average Duration Chart: 선택한 기간 동안 Agent가 처리한 Chat의 평균 Duration을 그래프로 나타냅니다.
-
Agent Performance Details Table: 개별 Agent의 성과 지표를 나열한 상세 테이블이며, 다음 항목을 포함합니다.
- Agent Name (Agent 이름)
- Chat Count (Chat 수)
- Average Response Time (평균 응답 시간)
- Average Chat Duration (평균 Chat 지속 시간)