시계열 분석
Time Series Analytic 페이지는 지정된 기간 동안 데이터의 트렌드와 패턴에 대한 상세한 인사이트를 제공합니다. 시간 경과에 따라 주요 지표가 어떻게 변화하는지 분석하여, 과거의 성과를 바탕으로 데이터 기반의 의사 결정을 내릴 수 있도록 돕습니다.
-
Date Range Selector: Analytics 데이터를 볼 기간을 선택할 수 있습니다.
- 오늘 (Today)
- 지난주 (Last week)
- 지난 30일 (Last 30 days)
- 지난 90일 (Last 90 days)
- 지난 180일 (Last 180 days)
-
Date Display: Analytics 데이터에 대해 현재 선택된 날짜 범위를 보여줍니다. 사용자 지정 날짜를 선택할 때 사용할 수 있습니다.
-
Total Chats: 선택한 기간 동안 발생한 전체 Chat 수를 표시합니다.
-
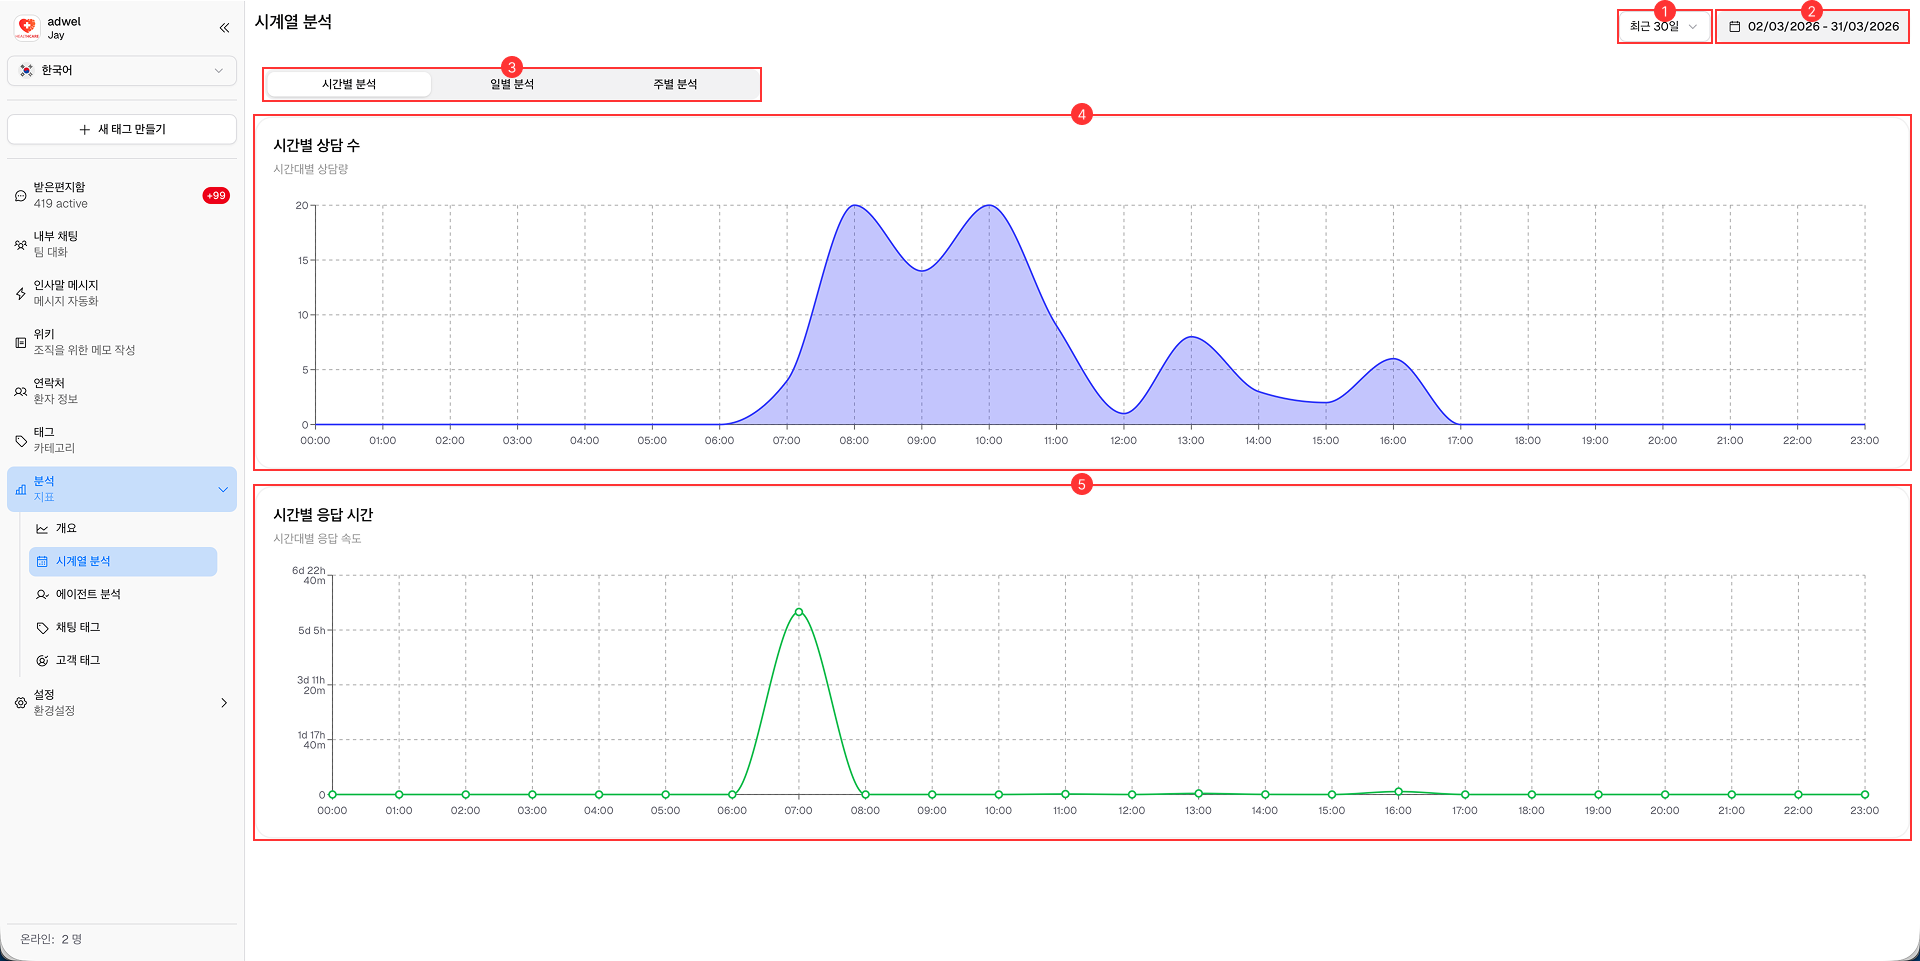
Time Series Tab: 이 탭에서는 데이터를 다양한 시간 간격으로 추적할 수 있습니다.
- Hourly (시간별): x축에 하루의 시간(0-23)을 나타냅니다.
- Daily (일별): x축에 선택한 날짜 범위의 일자를 나타냅니다.
- Weekly (주별): x축에 선택한 날짜 범위의 해당 주 첫 번째 요일을 나타냅니다.
-
Chats Chart: 선택한 기간 동안의 Chat 수를 시각적으로 나타냅니다. 이 차트는 Chat 규모의 트렌드와 패턴을 파악하는 데 도움을 줍니다. 선택한 시간 간격(Hourly, Daily, Weekly)에 따라 변경됩니다.
-
Response Time Chart: 선택한 기간 동안의 평균 Response Time을 시각적으로 나타냅니다. 이 차트는 Agent가 Chat에 얼마나 빠르게 응답하는지 모니터링하고, 응답 시간의 변동을 파악하는 데 도움을 줍니다. �이 역시 선택한 시간 간격(Hourly, Daily, Weekly)에 따라 변경됩니다.